Docs › Using Zalosim
Logical operations
Logical operations do not process material. They link and steer the flowsheet: reach a target, copy a value, calculate with cells, or sweep a variable.
Adjust, Set and Spreadsheet come from the Manipulator group of the palette. Case Studies and Data Tables are added from the navigator pane. Recycle is described with the unit operations.
Choosing variables
Whenever a logical operation needs a variable, it opens the Variable Navigator: filter by All, Streams, UnitOps or Logicals, pick the object in the OBJECT list, the variable in the VARIABLE list, and tap Select (or Add).
Only some variables can be changed by a logical operation:
- on feed streams: temperature, pressure, vapour fraction, molar, mass and std ideal liquid volume flow;
- on product streams: the temperature from a heater or cooler, or the pressure from a valve, pump or compressor;
- heater and cooler outlet temperature and duty; valve, pump and compressor outlet pressure; column reflux ratio (columns with a condenser);
- spreadsheet cells that hold a typed number.
Many more can be read: all of the above plus component mole fractions and molar flows, heat exchanger duty, pipe segment pressure drop, heat loss and velocities, and any spreadsheet cell with a value.
Adjust
An Adjust varies one variable until another reaches a target. For example: change a valve's outlet pressure until the cold separator reaches 30 °F.
Connections tab
- ADJUSTED VARIABLE: the variable to change. Tap Select Var....
- TARGET VARIABLE: the variable to bring to the target.
- TARGET VALUE: User Supplied gives a Specified Target Value; Another Object uses another variable plus an Offset.
- Start runs the solver once everything is given. If the solver is on hold, it reminds you to press the green solver button.
Parameters tab
| Field | Default |
|---|---|
| Solving Method | Secant |
| Tolerance (absolute) | 0.0001 in the target's internal SI unit, for example 0.0001 K for a temperature |
| Step Size | 1 % of the adjusted value (1 if the value is 0) |
| Minimum (Optional), Maximum (Optional) | <Unbounded> |
| Maximum Iterations | 50 (1 to 1000) |
Monitor tab
Shows the iterations, the error, the adjusted and target values and the status. The solver bar's Messages pane logs each iteration, for example ADJ-1: Iter 3 Target value: … Match value: … Adjust value: ….
Every Adjust is solved as an outer loop around the whole flowsheet, on every solve. When several Adjusts are present they are solved together. If an Adjust fails, the message says why, for example Target cannot be reached within the limits of …, Not converged in 50 iterations or Flowsheet does not solve at the starting value. Give the adjusted variable a sensible starting value and, if needed, a minimum and maximum.
Set
A Set makes one variable follow another: Target = Multiplier × Source + Offset.
- Connections: pick the TARGET VARIABLE first, then the SOURCE object, which must have the same kind of variable.
- Parameters: Multiplier (default 1) and Offset (default 0).
The solver runs a Set after the object it reads and before the object it writes.
Spreadsheet
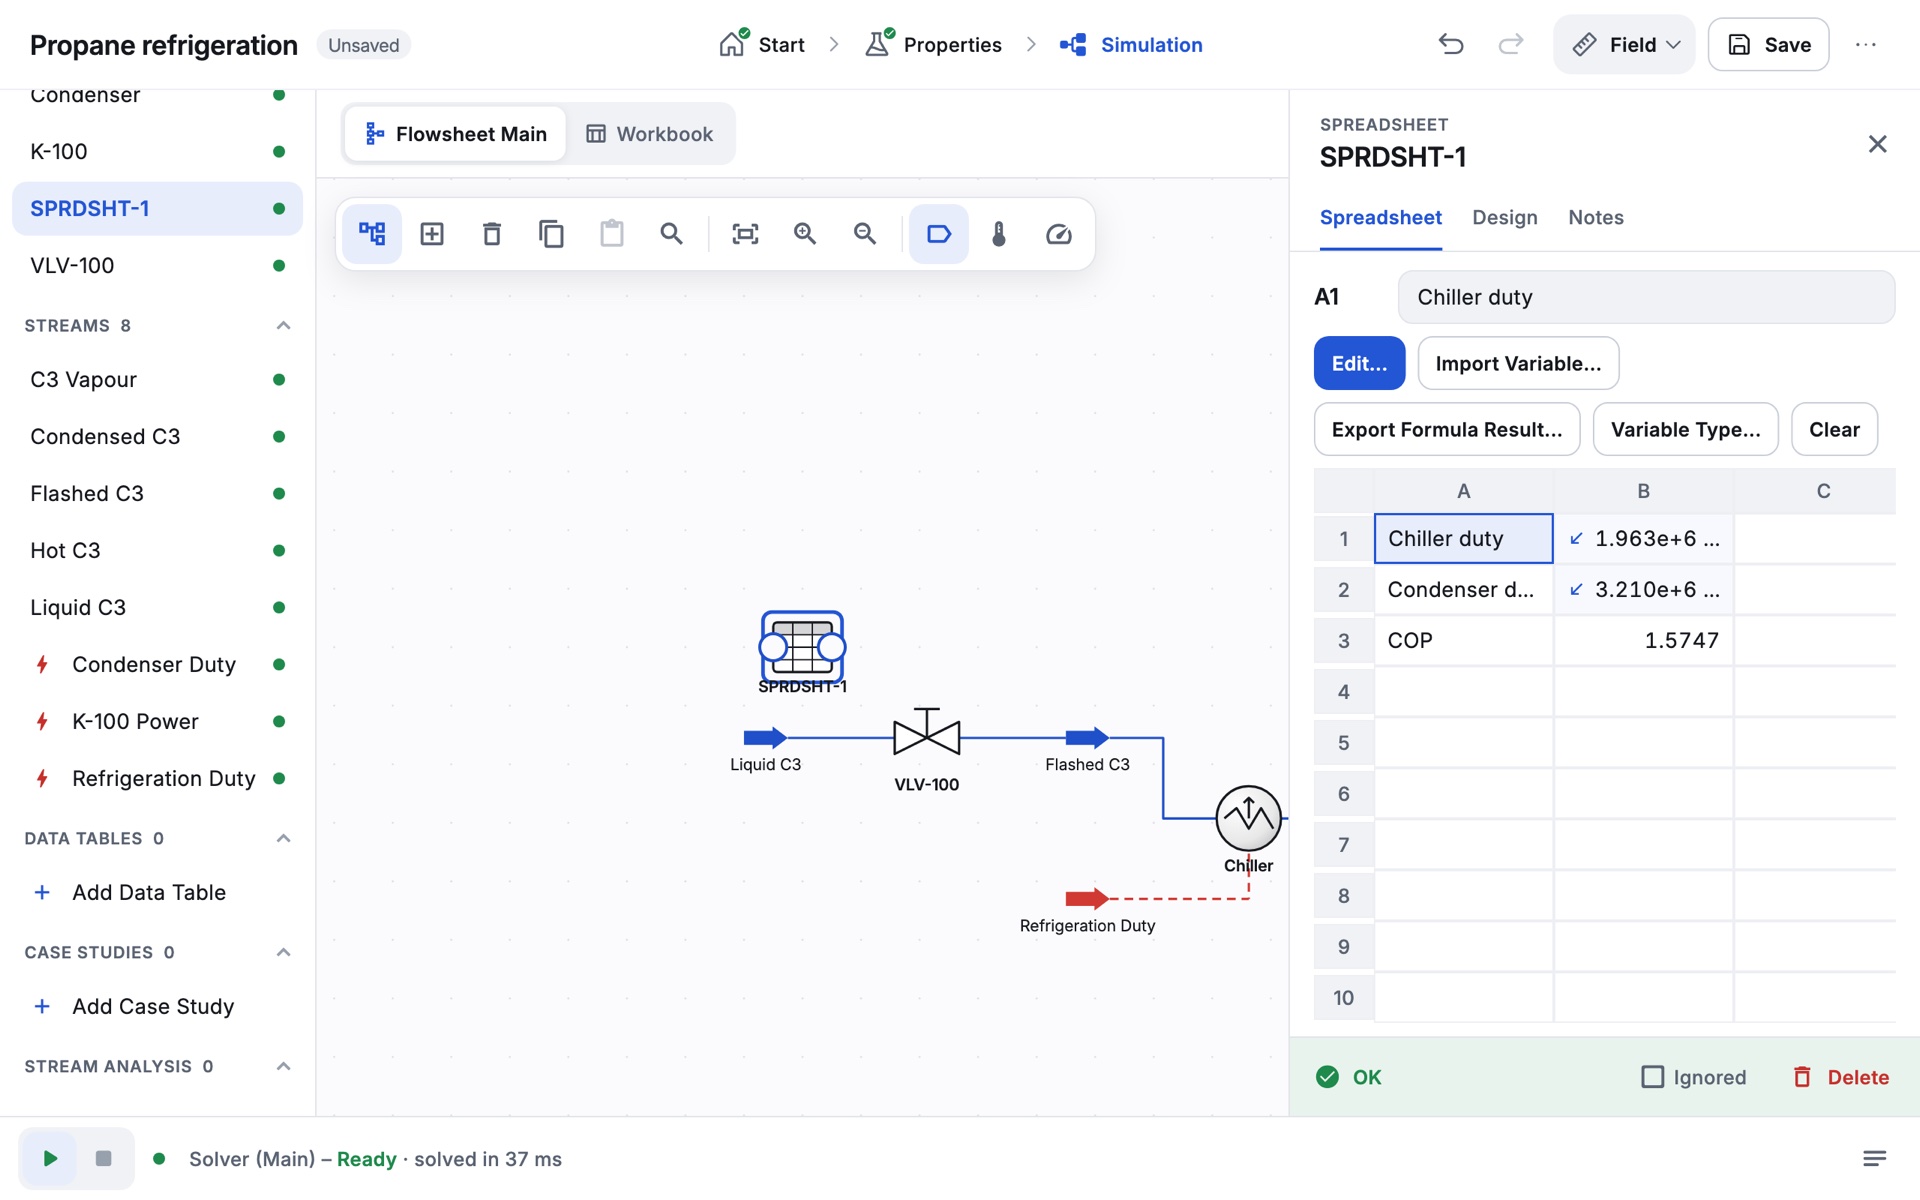
=B1/(B2-B1): the coefficient of performance of the refrigeration loop.A Spreadsheet is a small grid of cells that can read values from the flowsheet, calculate with them, and write a result back. It has three tabs: Spreadsheet (the grid), Design (Connections, Parameters, Formulas) and Notes.
Cells
- Tap a cell to select it, tap it again (or Edit...) to type. A cell holds a number, text, or a formula starting with
=(or+). - Import Variable... fills the selected cell from a flowsheet variable. Export Formula Result... writes the cell's value to a variable that can be changed. Variable Type... sets the kind of quantity a typed cell holds (temperature, pressure, flow, energy…). Clear empties the cell.
- The grid starts at 4 columns by 10 rows; change it on Parameters (up to 26 columns and 200 rows).
- The Connections page lists every imported and exported variable, with Add Import... and Add Export....
Formulas
| Item | Supported |
|---|---|
| Operators | + - * / ^, unary minus, brackets |
| References | Cells such as A1 ($ signs are ignored); ranges such as A1:B3 inside functions |
| Functions | ABS, SQRT, EXP, LN, LOG (base 10), SIN, COS, TAN, ASIN, ACOS, ATAN (radians), PI(), MIN, MAX, SUM, AVG (or AVERAGE) |
| Not supported | IF and comparisons |
Units in formulas
Cells are shown in your unit set, but formulas calculate in fixed internal units: °C, kPa, kgmole/h, kg/h, m³/h and kJ/h. Bear this in mind when a formula adds a constant to a temperature or pressure. Ratios of like quantities, such as the COP above, are unaffected.
A cell with a problem shows red text, and the Formulas page lists each formula with its result or error, for example A1 is empty, Division by zero or Unknown function "X".
Case Study
A Case Study sweeps one variable over a range and records how others respond, without changing your flowsheet.
- In the navigator pane, under Case Studies, tap Add Case Study.
- On Setup, tap Select a specification… under INDEPENDENT VARIABLE and pick a variable that can be changed (feed conditions, heater or cooler outlet temperature, valve outlet pressure, column reflux ratio, or a number cell).
- Set Low Bound, High Bound and Step Size. Up to 100 points are allowed.
- Under DEPENDENT VARIABLES, tap Add for each result to record.
- Tap Run. The Results page shows a plot of each dependent variable and a table of every point. Points that did not solve are left out of the plot.
The study runs on a copy of the case, each point starting from the previous solution. The solver must be active (not on hold). Results are saved with the case and cleared when you change the setup.
Data Tables
A Data Table collects variables from anywhere in the flowsheet into one live list. Under Data Tables in the navigator pane, tap Add Data Table (it is named ProcData1, ProcData2…), then Add variables. Each row shows the object, variable, current value and unit. Use it to watch the numbers that matter while you change the case.
For a worked example of Adjust, Spreadsheet and Case Study, see the tutorial Adjust, Spreadsheet and Case Study.